Show me your fifty percent line and your over/under split, and I’ll reveal to you your future. The most pivotal question is, what will you do about it? Because, ready or not, the problem of declining giving is already impacting you, and it will not get any better, and if you do nothing, it will worsen sooner rather than later! The 50% Line and your Over/Under Split are predictors of your future.
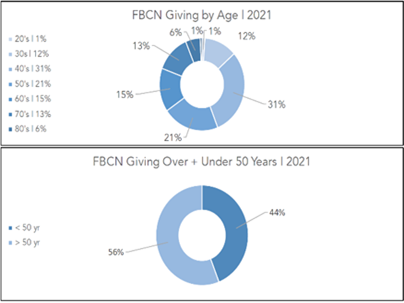
The chart at the left is from FBC Newcastle OK, one of Oklahoma’s fastest-growing churches. The Executive Pastor put this chart together after I had shown him a chart of a church with 84% of its yearly giving coming from those fifty and above. So, I asked him if he knew his over/under-split. He sent me this chart. This is what a healthy Over/Under Split should look like.
This isn’t a comparison contest. The community around FBC Newcastle is exploding. So, a 44/56 split might be the average for fast-growing churches, while others might see a sustainable financial future with a 30/70 split. Notice the strength of their donors in their 40’s and 50’s. Those are the prime earning decades for Americans. So, each church’s community and context matter. But every church must know if its key donor base is aging out. Find someone on your team or staff who can assemble your own over/under chart for you. Print it in color.
Find out your 50% line. What percentage of your donors give 50% of all that is given? That is your 50% Line. Every pastor should know this and know the exact number of donors of that percentage. Again, hide the names if necessary, but see the numbers on a spreadsheet. It’s a reality check. I contend that this list is incredibly connected to your church. Their gift of time and money reflects that. So, think of this group as one of your discipleship groups that can and will develop into your Legacy Team.
Do another over/under review of your 50% line. How many are over fifty, and how many are under fifty? In the typical church today, most gifts come from those over fifty. So, break it down by ten-year age groups. Then print it off in color. What does that show you? If the overwhelming majority of those on your 50% list are well over seventy, you have some work to do.
How might this impact you? Here is a chart of a presentation I made at a conference in Illinois a few years ago. I found what an Elementary Teacher in their area made annually. In Illinois, at that time, teachers with over 30 years of service and 55 years of age could retire at 75% of their top pay. So, doing the math, here is what I came up with:
- A teacher in Illinois with 30 yrs. and age 55 makes – $88,499.
- She gives the 10% tithe – $8,850 to your church.
- This is her last year teaching, so next year, she will retire at 75% of her salary – $66,374.
- Her 10% tithe is now – $6,637.
- Your church just took a 25% hit to your bottom line!
Multiply this out by the percentage of your donors on your chart at or near retirement.